Bitcoin has been experiencing a bearish retracement following a significant rejection from the 100-day and 200-day moving averages. This highlights the prevailing dominance of sellers, who seem to be intending to drive the price lower.
Technical Analysis
By Shayan
The Daily Chart
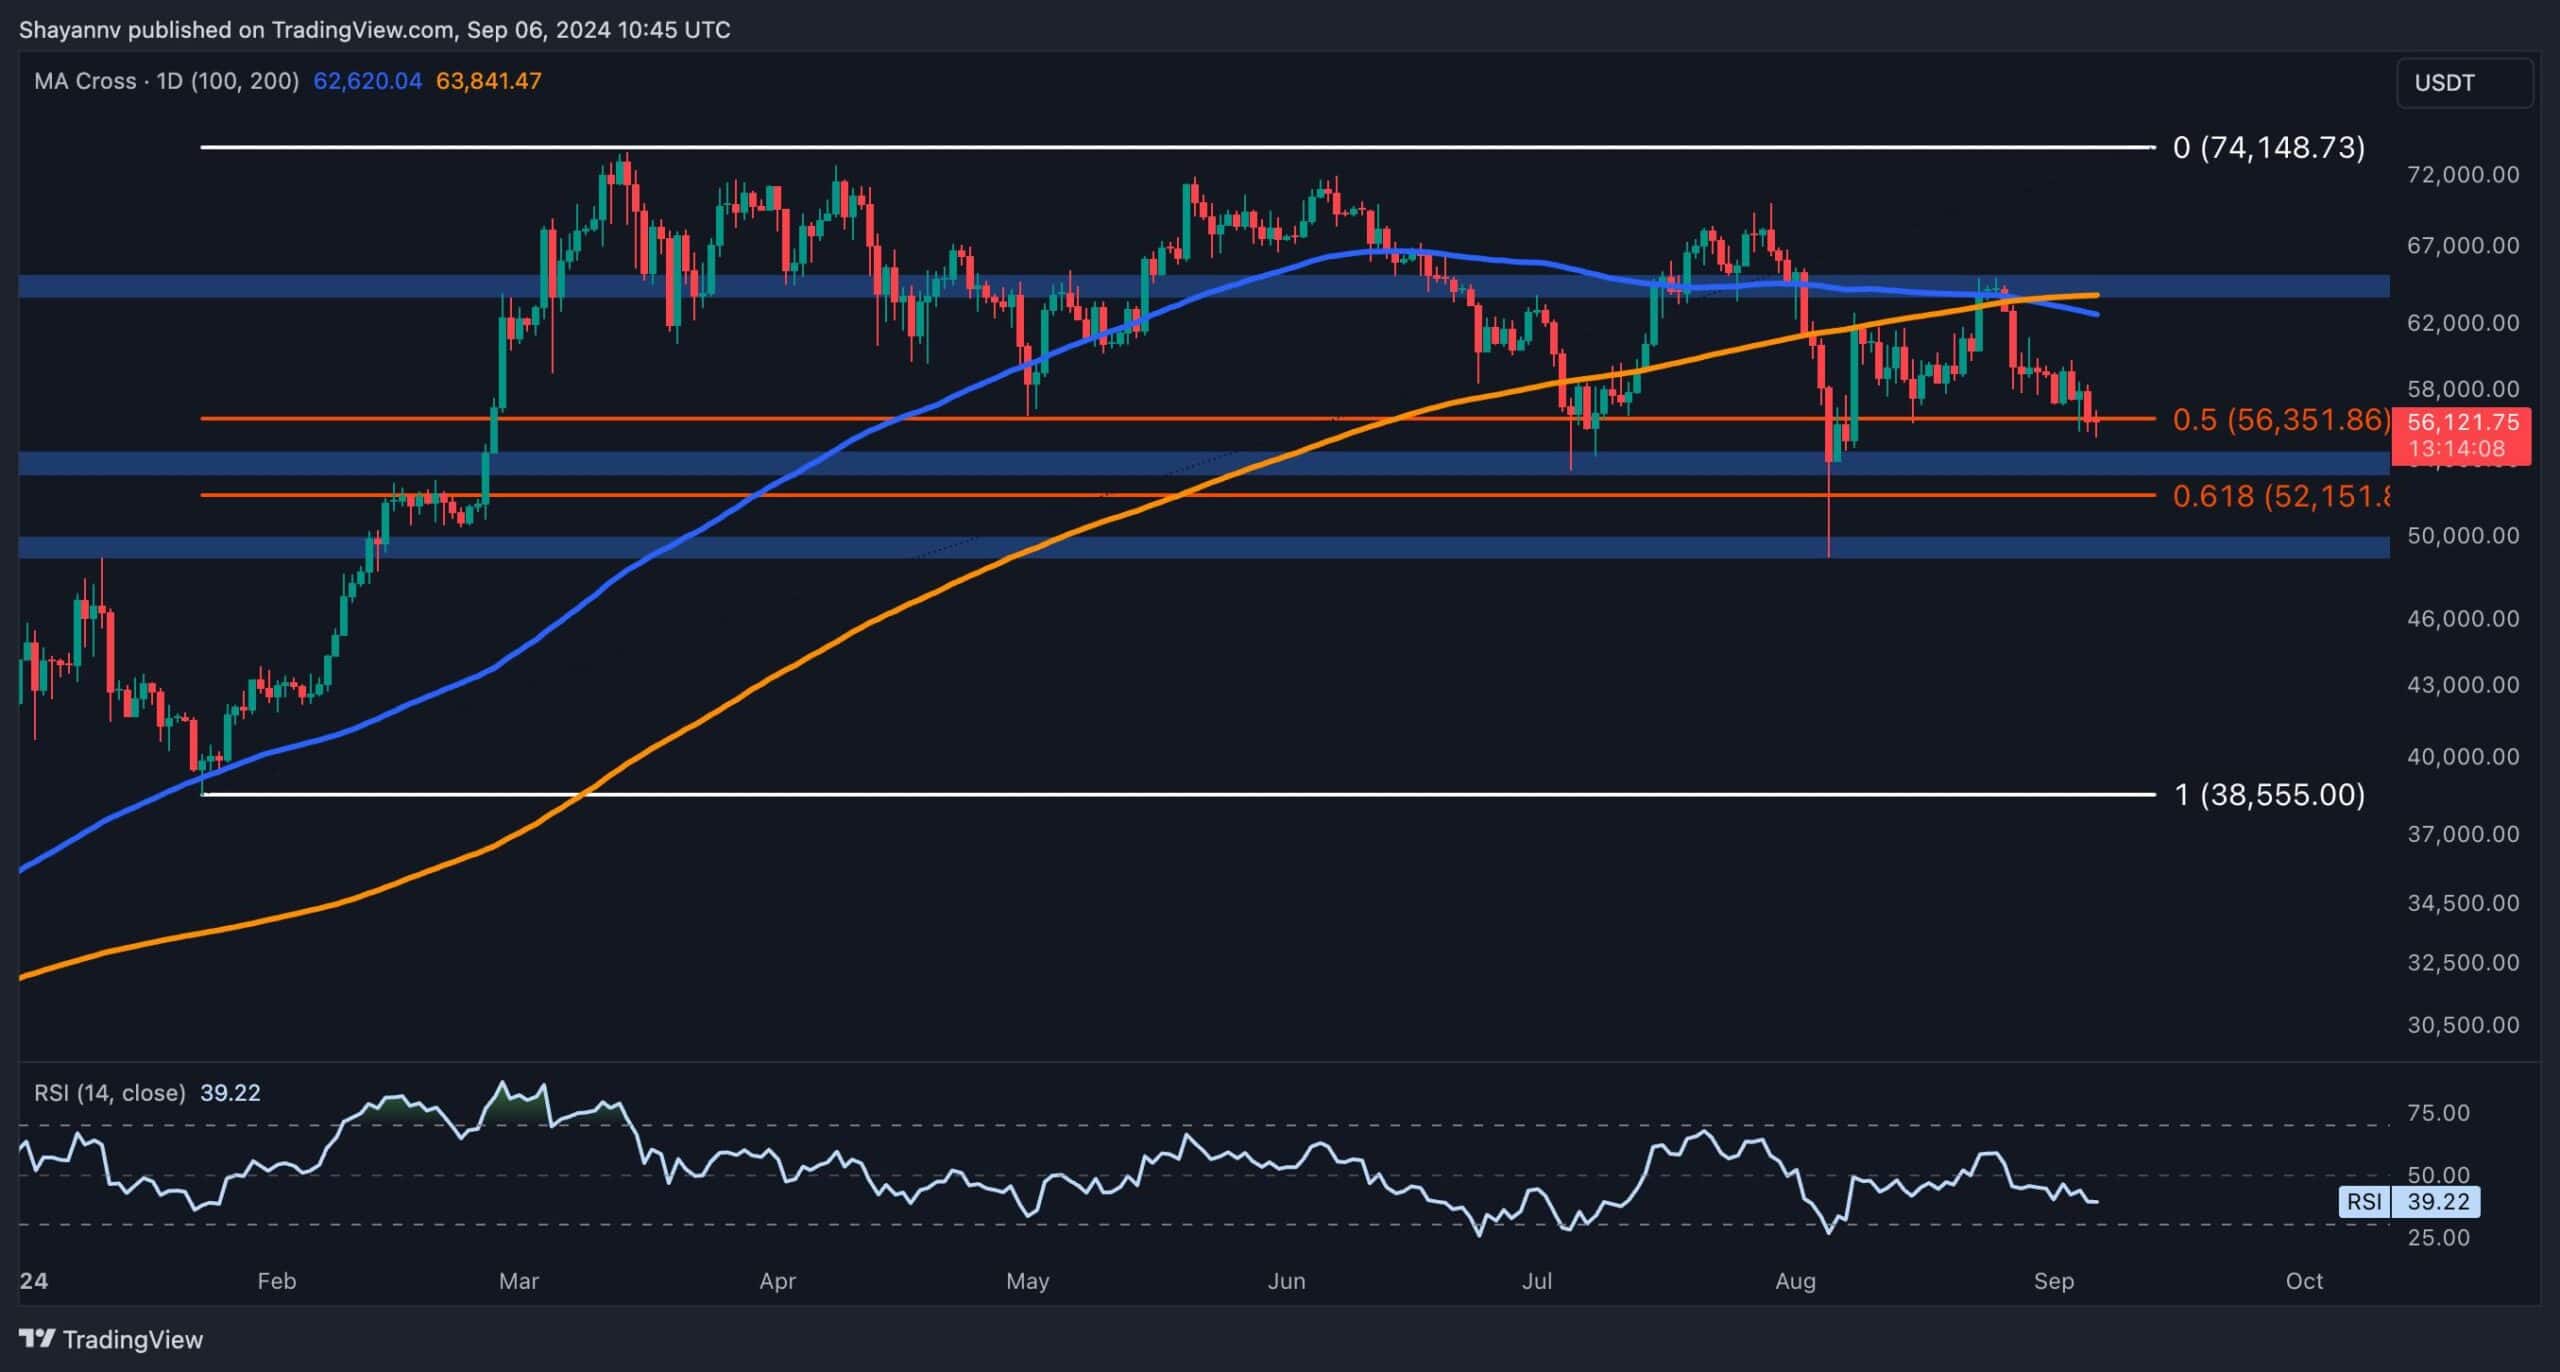
A closer look at Bitcoin’s daily chart shows that after a surge toward the 100-day and 200-day moving averages around the $64K mark, the price faced intensified selling pressure and was notably rejected.
This resulted in a pullback to these broken moving averages, signaling the beginning of a bearish decline. The price action indicates that sellers are firmly in control, with the 100-day MA crossing below the 200-day MA to form a “death cross,” further reinforcing the bearish outlook.
Currently, Bitcoin has entered a key support zone defined by the 0.5 to 0.618 Fibonacci retracement levels. This zone could provide temporary relief from the downtrend, potentially leading to a period of sideways consolidation.
Source: TradingViewThe 4-Hour Chart
On the 4-hour chart, Bitcoin’s price has seen a clear bearish rejection at the $64K resistance level, leading to a steady decline.
The failure to establish new higher highs has turned the market trend decisively bearish, with lower highs and lower lows signaling intense selling activity. Bitcoin now sits at a critical support zone defined by the 0.5 and 0.618 Fibonacci retracement levels.
If sellers push the price below this range, the next target is the key $50K support level, where significant buying pressure may reemerge. Conversely, if Bitcoin finds support at this level, a bullish rebound toward the psychological $60K resistance could materialize.
Source: TradingViewOn-chain Analysis
By Shayan
Examining futures market metrics can provide valuable insight into sentiment when assessing Bitcoin’s price movements. One key indicator is the Taker Buy/Sell Ratio, which measures whether buyers or sellers are more aggressive in executing their orders.
The chart shows a significant decline in the ratio after Bitcoin’s rejection from the $64K level. This drop indicates a surge in market sell orders, reflecting a broader sentiment of distribution among traders.
This behavior underscores growing bearish expectations as traders are positioning for a possible breakdown and further price declines, potentially toward the $50K support level. The increase in sell-side aggression indicates a short-term continuation of the bearish trend.
Source: CryptoQuant