Ripple recently faced significant selling pressure after being rejected at the critical $0.65 resistance level. This resulted in a 23% price drop, breaking below the 100—and 200-day moving averages.
This price action hints at a potential downtrend continuation toward the $0.5 mark.
XRP Analysis
By Shayan
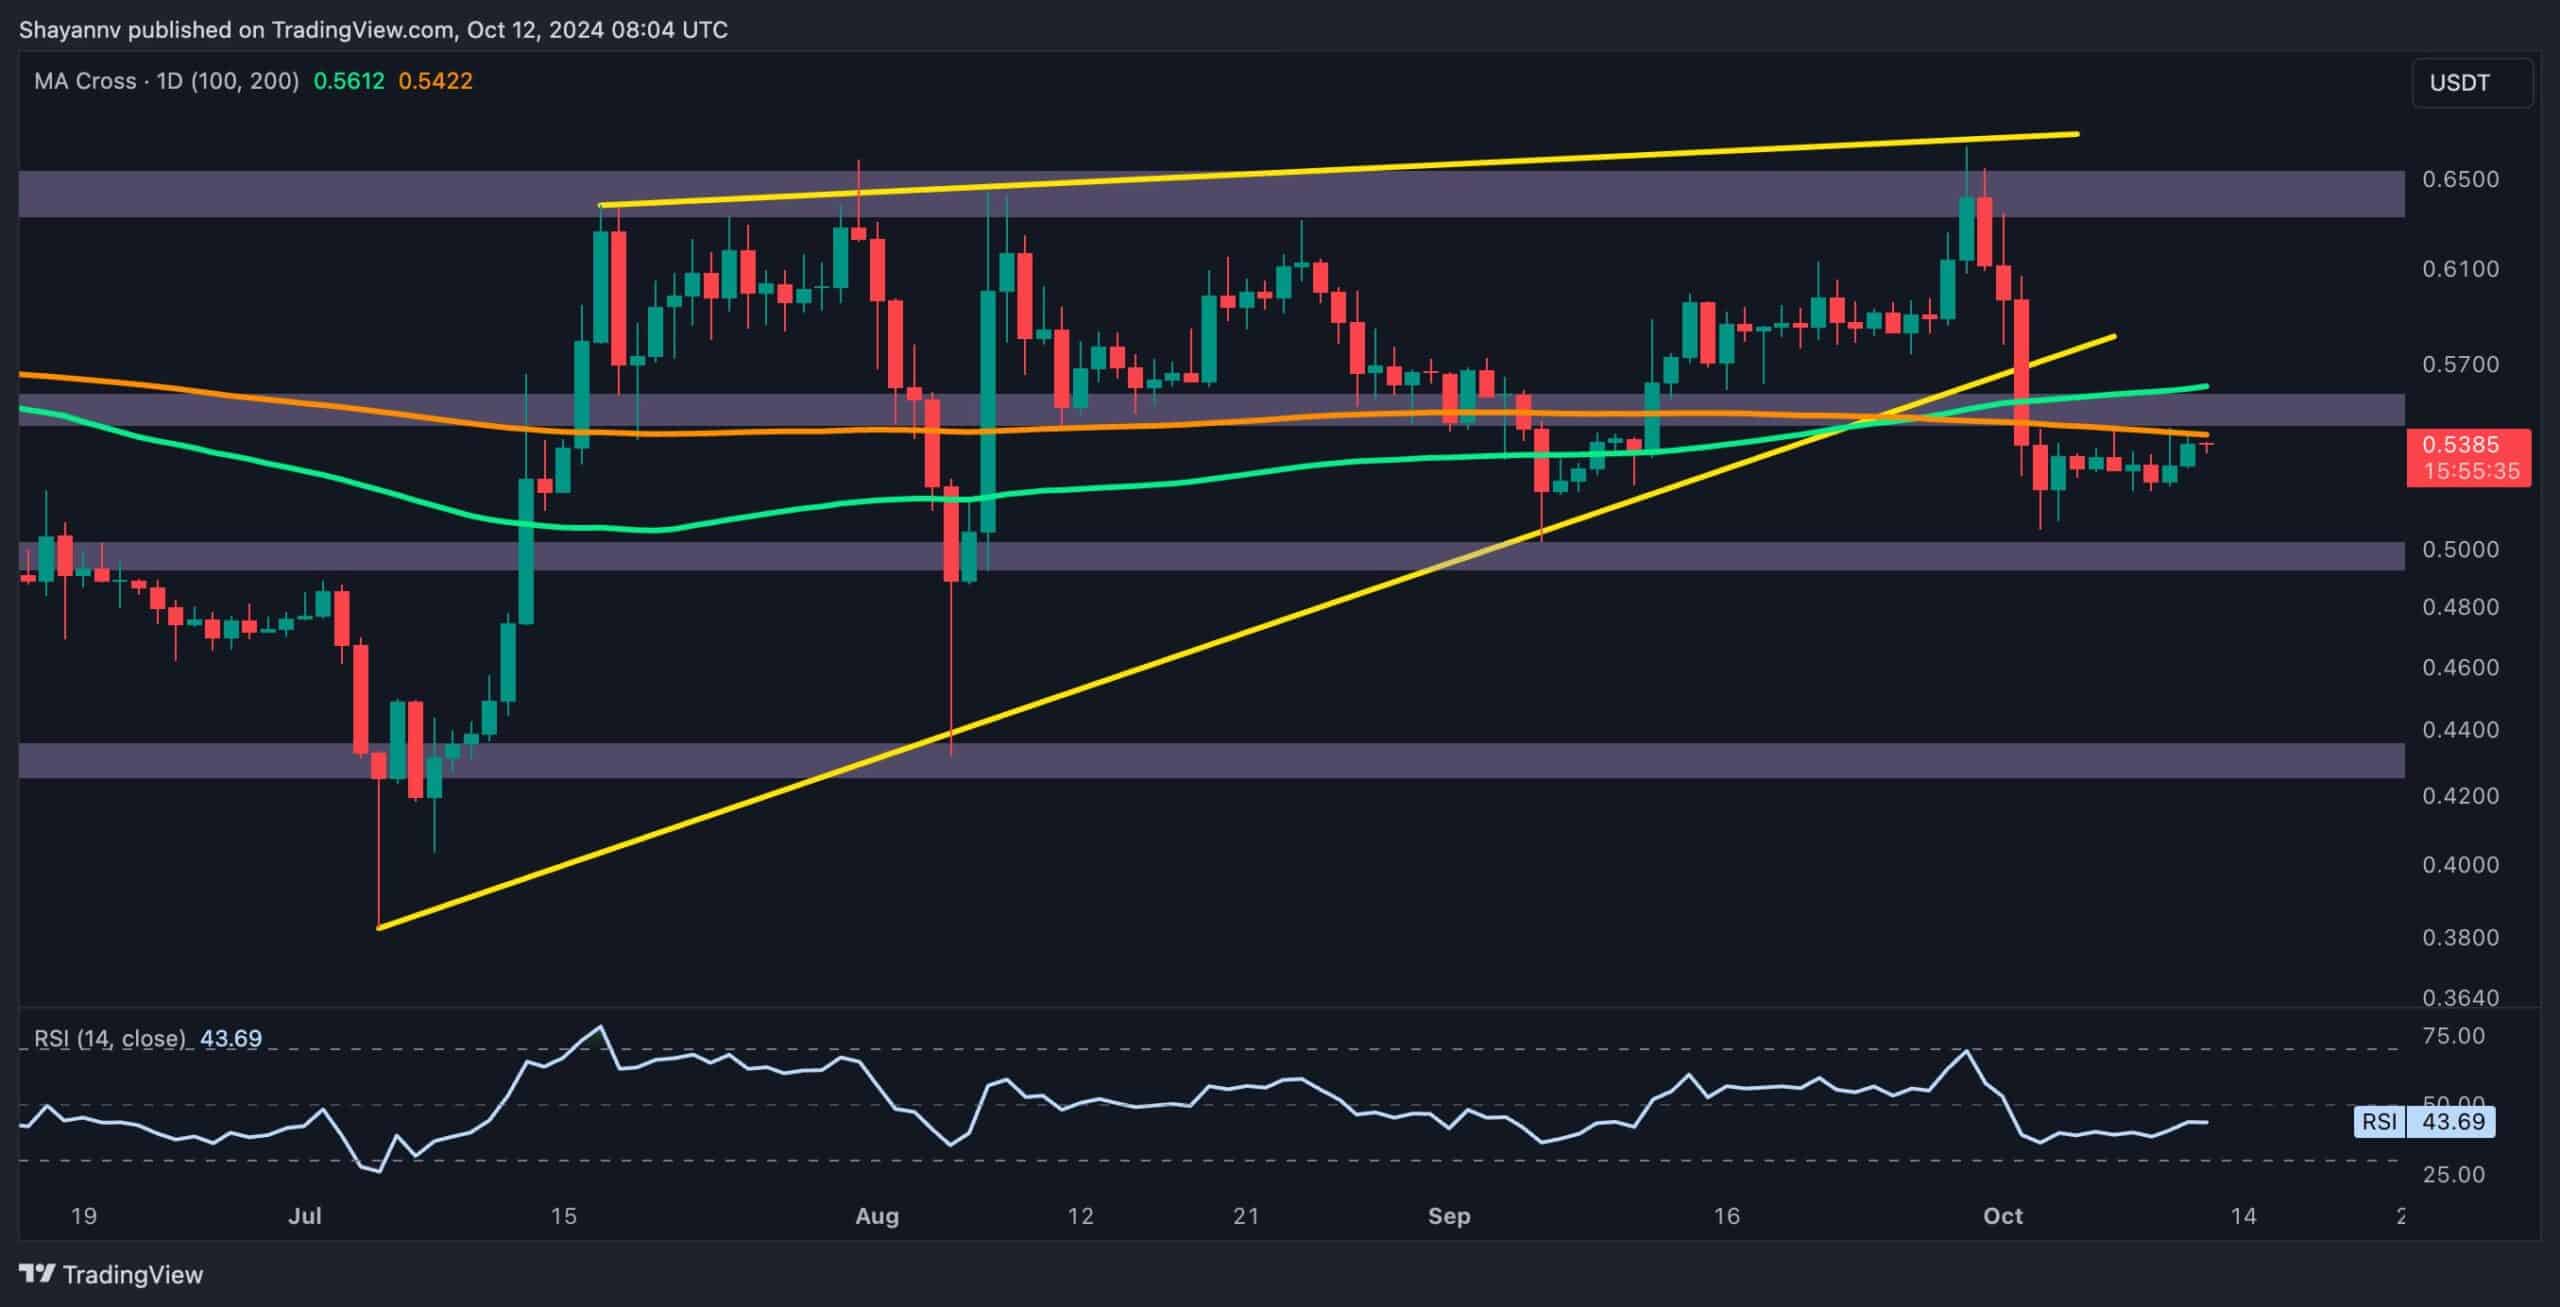
The Daily Chart
Ripple recently encountered intense selling pressure following a notable rejection at the critical $0.65 resistance level, resulting in a 23% decline. This zone has consistently turned back price advances in recent months, marking it a significant supply area. The recent rejection saw Ripple break below key technical levels, including the 100-day and 200-day moving averages, both situated near $0.55, signaling a decisive shift toward bearish control.
This price action is further accentuated by XRP’s drop below the lower boundary of a long-standing wedge pattern, reflecting a breakdown in market structure. The breach of these critical moving averages indicates sellers are in command, pushing the cryptocurrency toward lower levels, with $0.5 emerging as the next key support area.
Despite this solid bearish movement, XRP is undergoing a corrective retracement marked by low volatility, which could signal an impending pullback to test the broken regions near $0.55. If this occurs, it will likely solidify the bearish trend, paving the way for a continued decline toward the $0.5 support.
Source: TradingViewThe 4-Hour Chart
On the 4-hour chart, the rejection at the $0.65 resistance is evident, accompanied by a distribution phase as both smart money and retail traders exit positions.
This distribution has led to the sharp decline seen in recent days, underscoring the sellers’ dominance in the market.
Although bulls have made multiple attempts to reclaim the $0.65 resistance over the past months, the buying pressure has been insufficient to overcome the selling force, cementing bearish momentum.
The price has now dropped toward the crucial support range defined by the 0.5 ($0.52) and 0.618 ($0.49) Fibonacci retracement levels. This area is expected to act as temporary support for XRP, offering the possibility of a short-term bullish corrective move or a period of sideways consolidation before a clear trend direction emerges.
Source: TradingView